A practical case on using competitor price monitoring service with the following results: online store’s revenue growth by 36%, increased ROI in advertising by 8%. This material will not only change the way you think about your sales, but it will also show real results from a competitive pricing strategy. All indicators are illustrated with screenshots from Google Analytics.
Goal: Increase store sales and profitability
The STALL online store switched to the price monitoring service in June. The main purposes of using the service included:
1) competitive prices for goods;
2) increasing sales;
3) an increase in the return on investment in advertising;
4) liquidation of stale stocks and fast sales in future.
Project specifics
The STALL website presents popular products and rather rare gift items. In the first case, there is huge competition, and in the second, there is low competition. It is important that the prices of competitors were not tracked before using the uXprice service. Therefore, the prices for many goods were greatly overstated by 2-3 times, and some goods were sold at a price much lower than the market price. This fact influenced the rapid growth of key indicators after the change in prices to competitive ones.
Important functionality
1) Unlimited number of competitors for each position.
Many services are limited to specific stores to parse prices. STALL has no specific competing stores with a duplicate assortment. There are products that are beyond competition, and there are products with a large number of competitors (maximum – 377). On average 13 competitors for 1 product from more than 1000 different online stores. In particular, the prices of such sellers as ROZETKA, Prom, Citrus, MAKEUP and others are monitored. Here’s an example of a product that has 377 competitors:
It is important to note that at the time of price collection, all competitors are advertised for these products, which cuts off abandoned stores with irrelevant prices.
2) Tools for analyzing the obtained data.
The list of prices of all competitors is just an array of data. To effectively implement a competitive pricing strategy, resultant metrics are required. uXprice offers the following parameters to determine the competitive price for each product:
• number of competitors
• position of your price among all offers
• average price for all competitors
• percentage difference in your price from the average
• percentage difference in the minimum price among all competitors
• percentage difference in the maximum price among all competitors
• recommended price (if you wish, the formula for calculating this parameter can be changed “for yourself”)
3) Option to connect to the service API.
These are important parameters that are fundamental to making the right price decision. To understand the difference in prices, let’s say that the difference between the offer with the minimum and maximum prices for the STALL assortment reached 400% of the cost.
What factors became crucial when choosing a service
In addition to the above advantages, when choosing a competitor price tracking service for STALL, the following points were decisive:
• Ability to connect small and medium-sized online stores.
Many services work only with large marketplaces on a national scale.
• Easy to connect and use.
The overwhelming majority of services require complex integration with the website of the online store and programmer settings. And to use uXprice you only need a link to your Google Shopping feed.
• Fixed price for 1 check.
The price of 1 check is the price of finding all competitors for 1 product. This means that the cost of checking a product with 3 competitors will be the same as for a product with 300 competitors. By the way, if no competitors are found for the product, the check will not be charged. When replenishing, the money is immediately transferred to checks, which will be available within a year after the last replenishment of the balance.
• Tracking competitors without additional hardware and software.
This means that the search for competitors occurs automatically even if your computer is turned off, there is no Internet connection, and more.
• Personal setting of the recommended price.
This is an essential feature as price is an important parameter in e-commerce. Naturally, stores want to control it, and not mindlessly change it on the recommendation of a third-party service. The possibility of changing the formula for the recommended price for the individual needs of a particular business meets this need.
How to choose the best price to sell a product?
Every retailer asks the question: what price should I set? The lowest, mid-market or slightly above the market. The same question was at STALL store. There were two hypotheses:
1. Most of all sales are brought by commodity items that have the lowest price among competitors.
2. The best selling products are those with an average price, or with some deviation from the average. When confirming this hypothesis, it is necessary to find the value of this deviation.
To test the first hypothesis, a mysql query was created to the store database, which stores sales for all products for the last 30 days. This information has been combined with price position data from uXprice:
- The price position shows the number of products in the first ten positions among competitors, where the first position is the number of products with the lowest price among competitors, the second is the number of products with the second price position among competitors, etc.
- Delta from the average price of competitors is the percentage comparison of the price of a product with the average price among competitors.
After that, all the products of the store are divided into segments, depending on what price position among competitors. After that, the average number of sales per unit of goods in each segment is calculated.
The data was taken over 3 months. To calculate the Sales per unit of an item, the number of all sales for the selected period was divided by the number of items in the segment.
To test the second hypothesis, data with a delta (deviation) from the average price of competitors were downloaded from the uXprice service. Also, using a mysql query to the database, all products were divided into segments depending on the delta from the average price of competitors in 10% increments.
The result is product segments with the following deviations from the average price:
…- 50%, -40%, -30%, -20%, -10%, 0%, + 10%, + 20%, + 30%, + 40%, + 50% …
The first hypothesis was not confirmed. The minimum price position has no positive impact on sales. Sales will not increase if the store puts the lowest price in order to be the first among competitors.
The second hypothesis worked and showed that most of the sales are generated by the segment of products with a price 10% lower than the average among competitors. The segment with 0% deviation also worked well, where the price is the same as the average among competitors. The third in terms of sales turned out to be a segment with goods whose prices are 20% lower than those of competitors.
Products in other segments sold worse. It seems that too low a price alarms users and they hesitate to buy. Moreover, over 10% of the average price, the overwhelming majority of buyers are also not ready to overpay.
As a result, the store chose a strategy to set prices 10% lower than the average price of competitors. As it turned out, it worked well for increasing sales!
API integration
For convenience, STALL was connected to the uXprice service API. Thanks to this, the store was able to upload all data from the service directly to the server. Now the site admin panel on the price edit page has the “Recommended price” parameter with uXprice. Their developer made it possible to apply the recommended price immediately on the site. This parameter is preliminarily compared with the purchase price according to individually prescribed rules in order not to change the prices for goods for which the purchase price does not allow it.
Data obtained from the implementation of a competitive pricing strategy
Work on changing prices was launched on July 14 and lasted for about a week (5 working days). The first days were especially active. To ensure that high rates cannot be attributed to natural fluctuations, the analytics displays statistics for 15 days in comparison with the previous period. Here’s a screenshot from Google Analytics:
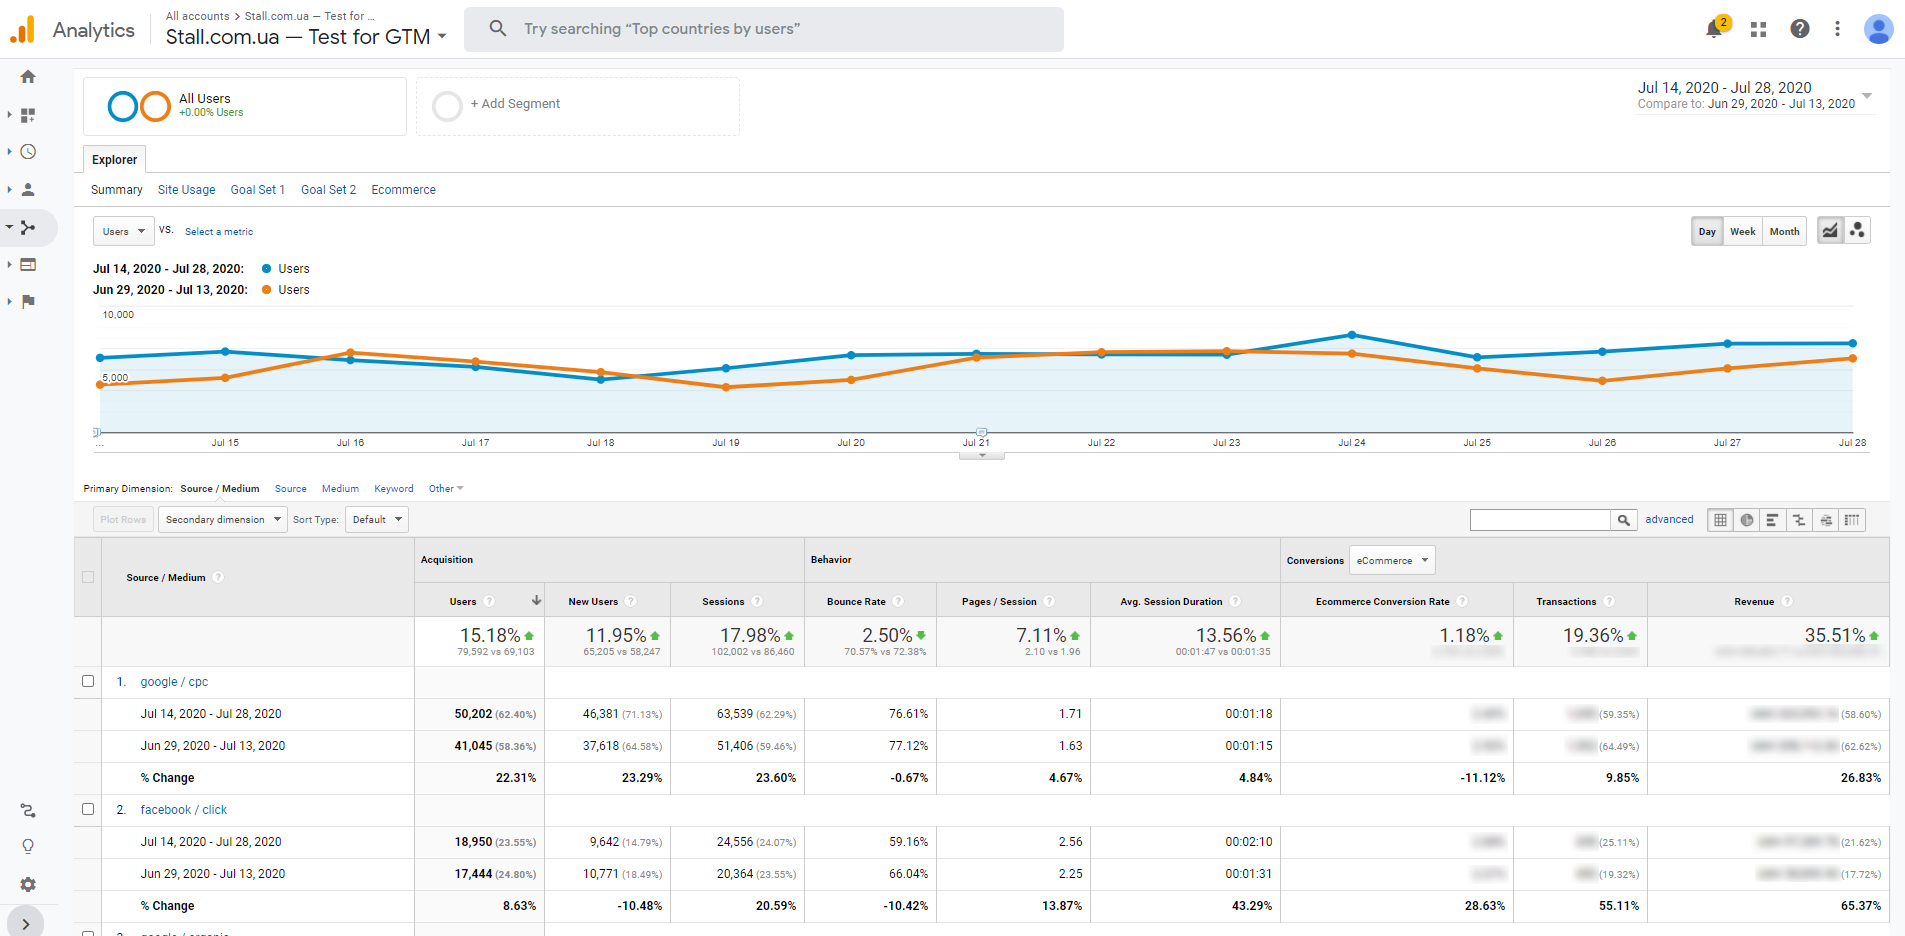
According to the report, revenue for the period July 14-28, 2020 increased by 35.51% from the previous period. The rest of the indicators show excellent dynamics:
• growth in the number of sessions per 1 user by 17.98%
• drop in bounce rate by 2.50%
• increase in the number of viewed pages for 1 session by 7.11%
• an increase in the average session duration of 13.56%
• increase of the transaction ratio by 1.18%
• growth in the number of transactions by 19.36%
It is interesting to analyze these results by traffic sources as well. It is worth saying that if such a significant increase in indicators for paid traffic channels (google / cpc and facebook / click) can be attributed to improving the performance of advertising campaigns, then this cannot be assumed about google / organic. Google organic revenue grew by almost 44% (43.62% to be exact).
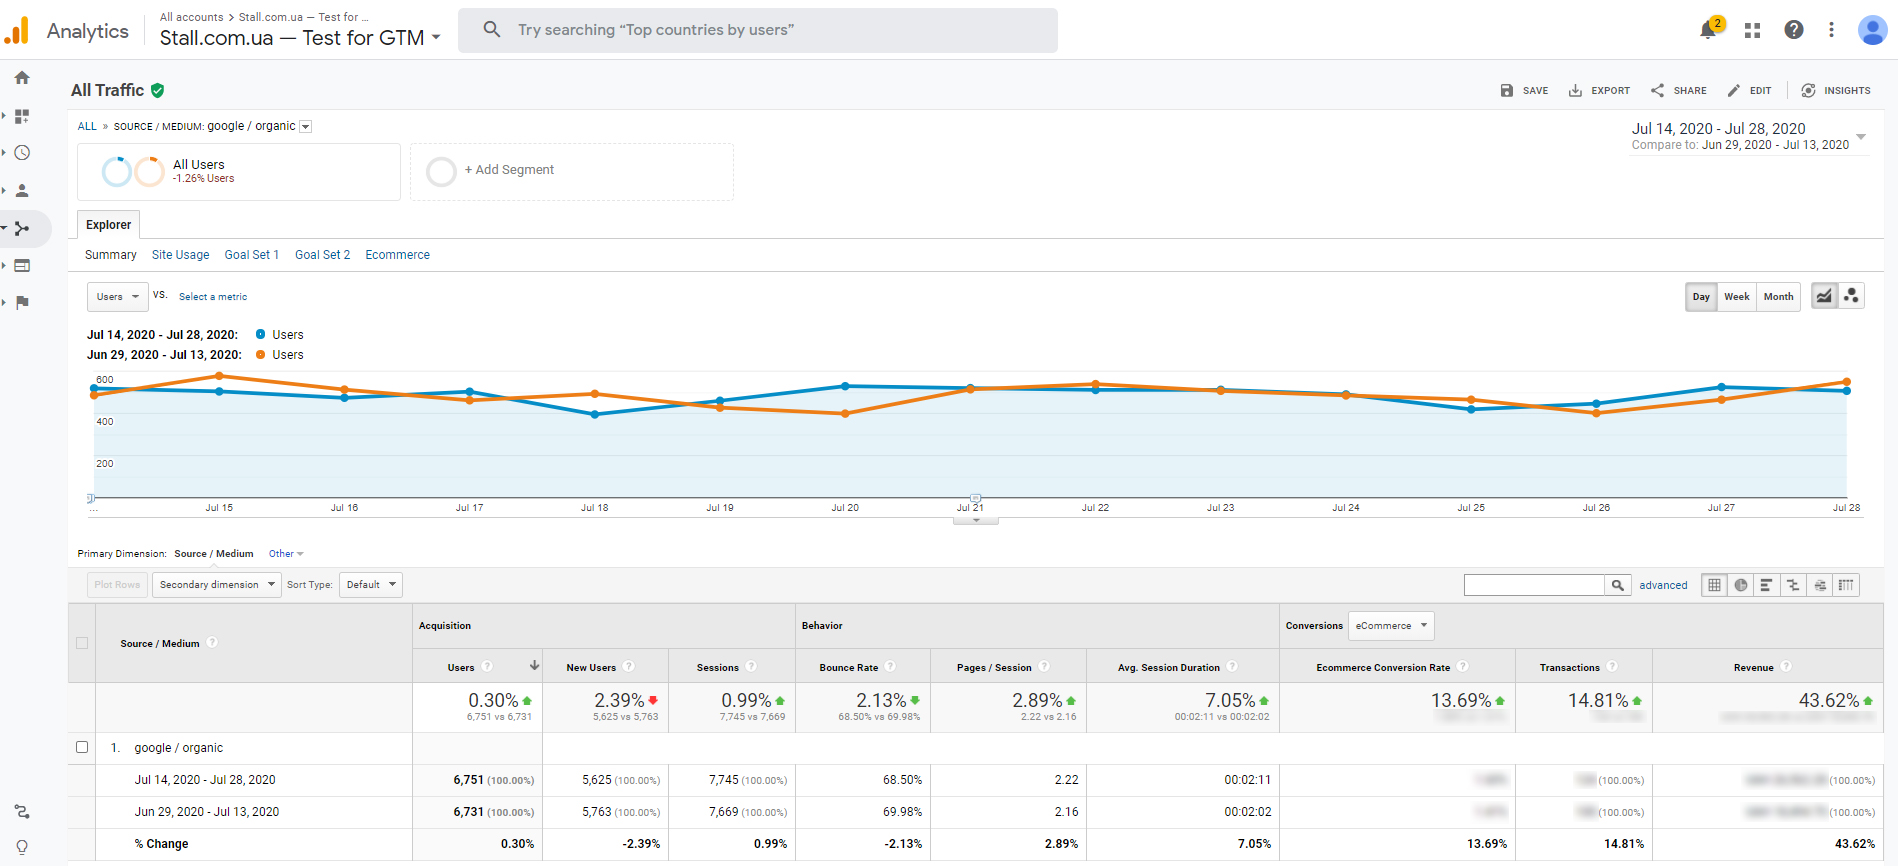
At the same time, the STALL report on google organic shows positive changes in all key parameters:
• growth in the number of sessions per user by 0.99%
• drop in bounce rate by 2.13%
• increase in the number of viewed pages for 1 session by 2.89%
• an increase in the average session duration of 7.05%
• increase of the transaction ratio by 13.69%
• growth in the number of transactions by 14.81%
Bounce Rate and Average Session Duration are the parameters that have a significant impact on SEO. Therefore, their improvement often leads to an increase in the site’s position in the search. But this is a longer lasting impact that can only be assessed over time.
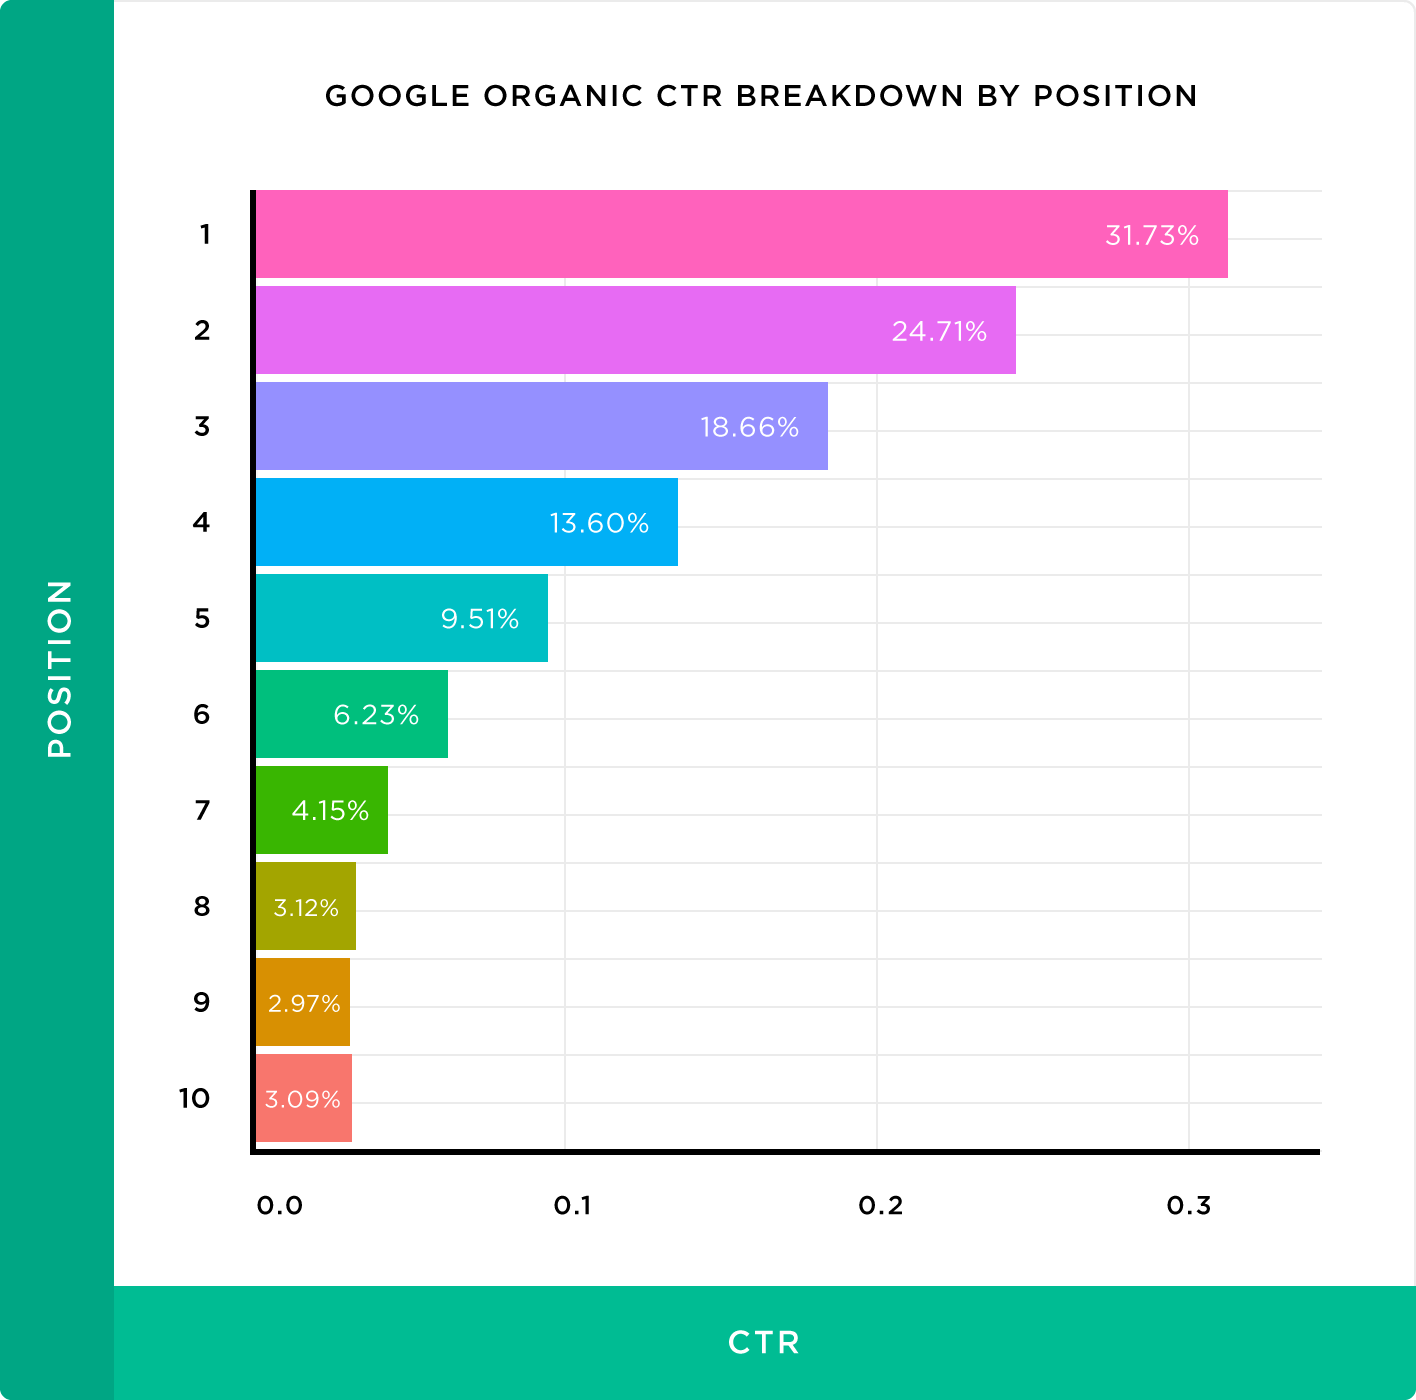
Most likely, these metrics were due to users with an adblocker enabled. For such buyers, the choice is limited to free issue. According to the research, only 9.5% of users click on the fifth position in free search results. This means that most of the users choose among 5 competitors. While users without an ad blocker have wider choice of stores.
This suggests that the price factor is even more significant for free search users than for paid traffic sources.
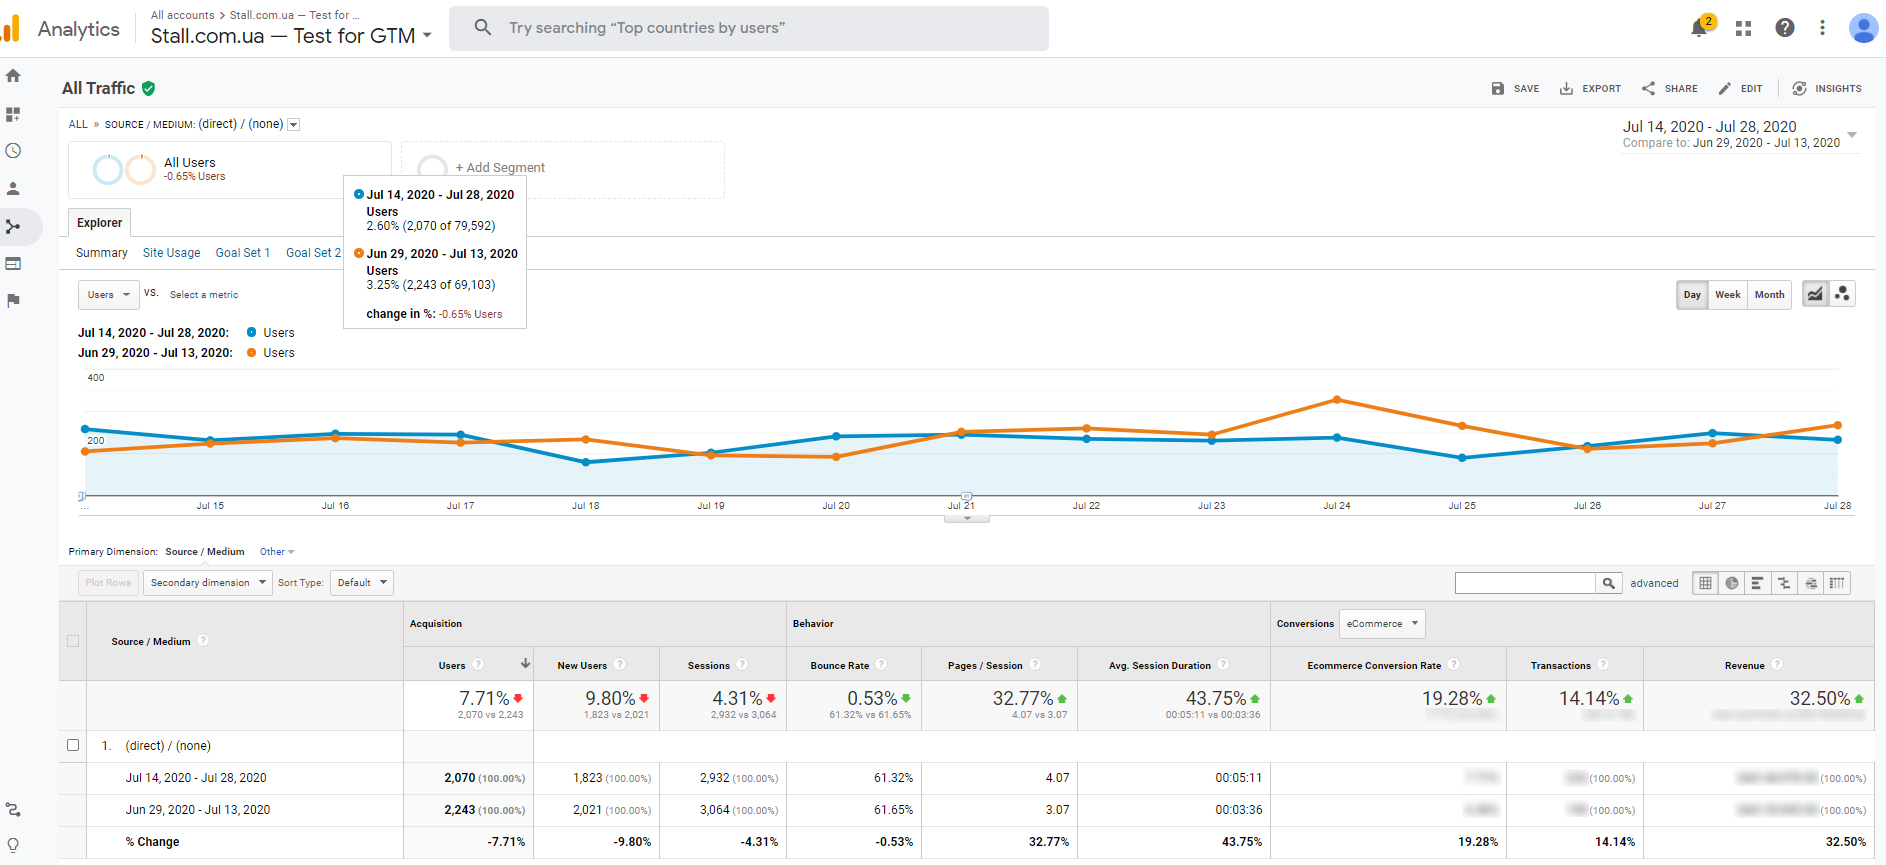
This is confirmed by statistics on direct visits (direct none). The income indicator increased significantly – by 32.5%. At the same time, there is a positive trend in other indicators:
• the bounce rate decreased by 0.53%
• the number of pages per session increased by 32.77%
• the average session duration increased by 43.75%
• increase of the transaction ratio by 19.28%
• the number of transactions also increased by 14.14%
A decrease in the total number of sessions by 4.31% is a natural phenomenon caused by a decrease in the number of users in this period compared to the previous one. Since this is also a free traffic channel, statistics distortion is impossible.
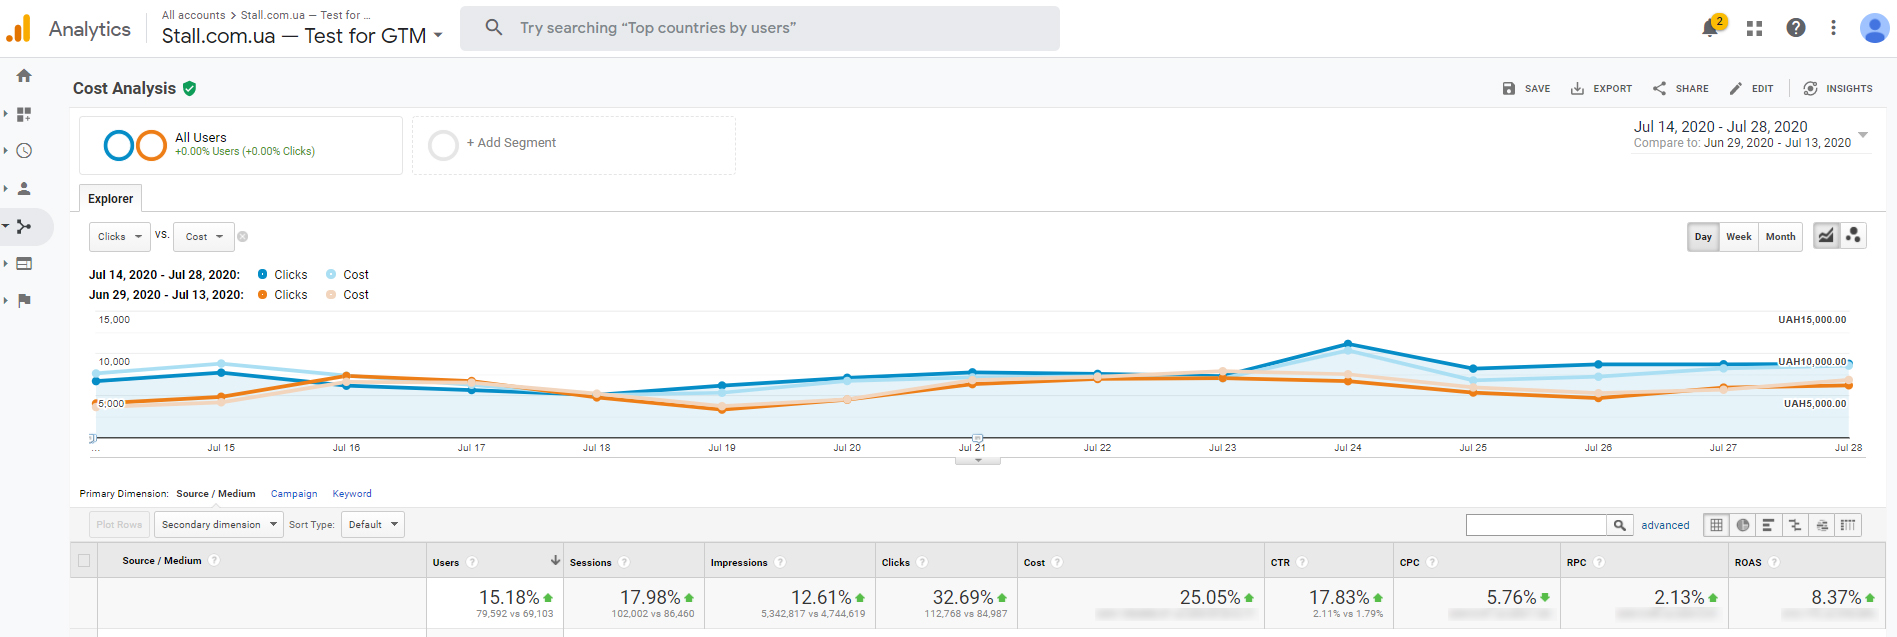
Let’s go back to the general indicators. Here’s another report from Google Analytics (average for the same period):
• the click-through rate of ads CTR increased by 17.83%
• ROI on advertising increased by 8.37%
• CPC drop by 5.76%
• revenue per click increased by 2.13%
Let’s clarify that according to statistics for previous years, there was always a decline in sales in the summer. Therefore, the rise in a number of key indicators cannot be attributed to seasonality. The budget for advertising campaigns has always been unlimited in the account. Consequently, its growth during this period is the result of improving many indicators, and not vice versa.
Increasing online store sales using competitive pricing
The analysis of price competitiveness in the STALL online store showed the need for timely tracking of competitors’ prices. On average, 70% of products have more than 100% difference between minimum and maximum prices for the same product. This means that sellers of these products also do not track the prices of their competitors and lose profits.
This case does not prove that your sales will definitely grow. Since there was a combination of several circumstances in this particular case :
– STALL online store has done a great job of integrating the uXprice API with its CRM and mathematically calculated the most profitable pricing strategy for itself;
– the store has most of the goods not branded, which does not tie the hands of the RRTs (recommended retail price);
– they did not track the prices of competitors before and therefore the prices were in a deplorable situation;
– the store has many competitors (small stores) that do not track competitors’ prices.
All of this together led to good results.
In this case, you saw a 2-month long journey, from the idea of tracking competitors’ prices to getting concrete results. Evaluating them, we can conclude that at the moment competitive pricing is an effective way to increase sales of an online store.
Here are some interesting materials for you:
Google Shopping Campaign Optimization Made Easy and Effective
How To Implement A Competitive Pricing Strategy That Is Hard To Beat


